Debugging
Debugging is an art and not a science. There is no step-by-step procedure or a single recipe for success when debugging a problem. Asking the following questions can help to understand and identify the nature of the problem and how best to solve it:
-
Is the problem easily reproducible?
-
Is there a reproducer or test that can trigger the bug consistently?
-
When the bug is triggered, are there any panic, error, or debug messages in the dmesg?
-
Is reproducing the problem time-sensitive?
When developing software in an embedded environment, the most likely scenario when testing a new hardware interface is… nothing happens. Unless things work perfectly, it is difficult to know where to begin looking for problems. With a logic analyzer, one can capture and visualize any data that is being transmitted.
For example, when working on software to drive a serial port, it is possible to determine whether anything is being transmitted, and if so, what. This becomes especially important where the embedded processor is communicating with an external device - where every command requires a transmitting and receiving a specific binary sequence. A logic analyzer provides the key to observing the actual communication events (if any!).
One of the most useful techniques for debugging software is to print messages to a terminal.
Serial communication through USART (Universal Synchronous Asynchronous Receiver Transmitter), in order to access a terminal on the board.
Asynchronous serial - debugging
How to approach debugging?
-
Make sure that you are working on code that is built cleanly—without warnings
-
You need to gather all the relevant data - in some cases, you may need to watch the user who reported the bug in action to get a sufficient level of detail
-
The best way to start fixing a bug is to make it reproducible. After all, if you can’t reproduce it, how will you know if it is ever fixed? Failing Test Before Fixing Code - be able to reproduce the case with one command
- Read the Damn Error Message
- Bad Results - What if it’s not a crash? What if it’s just a bad result? Understand the definition of fault, error, and failure (from ECE 716)
- Use a debugger - ensure you also see the incorrect value in the debugger
- Make sure you know how to move up and down the call stack and examine the local stack environment
- Keep notes of your process
-
Sensitivity to Input Values - get a copy of the data that makes your program fail, and make sure that it fails in your environment as well
-
Regressions Across Releases - look back into your release git history and see what release was the last one that worked fine and see what changes were introduced right before the bug
-
Use binary chop (binary search) - with the stack trace errors log, the releases between the current one and the last working, and with input data
- Logging and tracing
- Debuggers generally focus on the state of the program now. Sometimes, you need more—you must watch the state of a program or a data structure over time.
- Tracing statements are those little diagnostic messages you print to the screen or to a file that say things such as “got here” and “value of x = 2.”
-
Rubber Ducking - A very simple but particularly useful technique for finding the cause of a problem is to explain it to someone else.
- Don’t Assume It—Prove It Don’t gloss over a routine or piece of code involved in the bug because you “know” it works. Prove it. Prove it in this context, with this data, with these boundary conditions. - basically, what you learned at ECE 653
Systematic debugging:
- Debugging
- Tracing: is a specialized use of logging to record information about a program’s execution.
- Profiling: measuring an application or system by running a profiler analysis tool. Profiling tools can focus on many aspects: function call times and count, memory usage, CPU load, and resource usage
Debugging Tools and Techniques
Software
- Tracing - print statements to the terminal, logs
- GDB
- Kernel - KGDB
- Stack trace analysis (kernel - scripts/decode_stacktrace.sh)
Hardware
- Oscilloscope
- Logic Analyzer
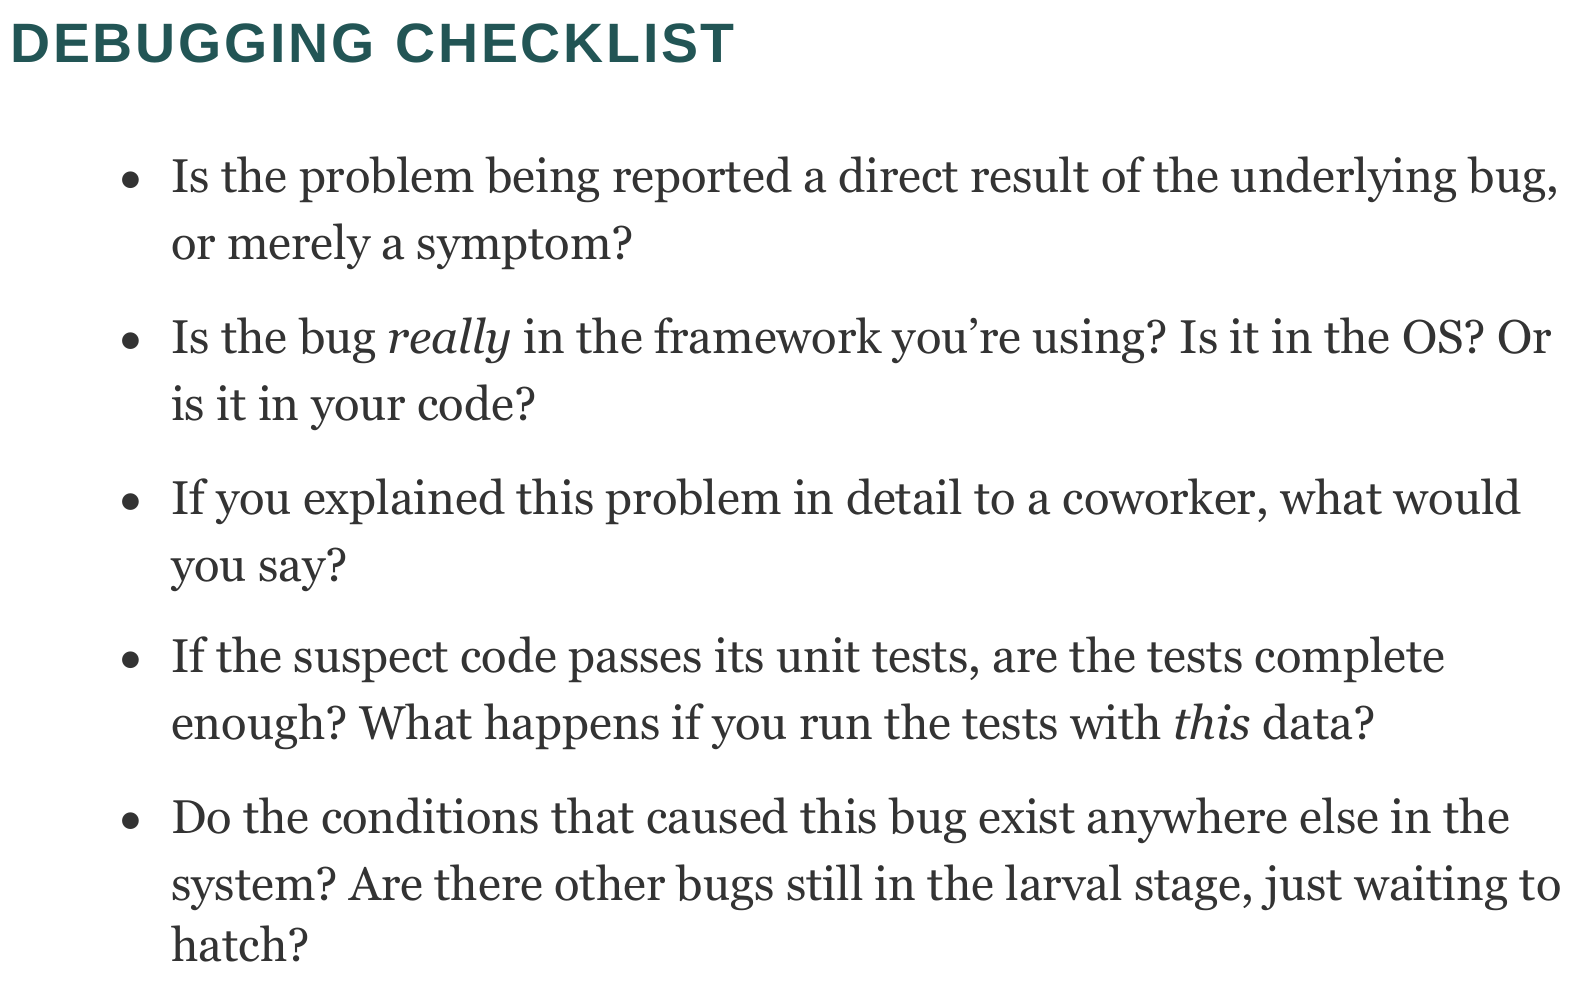
Debugging Checklist
Frequently Asked Questions
How do you approach debugging? System debugging
The 13 Golden Rules of Debugging by Sebastian Fischmeister
-
Understand the requirements: make sure you build the right program, have the right environment and tests.
-
Make it fail: find a clear error state; will also serve as an input for regression test; example: assert statements; with timing error, place a guard that checks whether something has been completed.
-
Simplify the test case: complicated test cases complicate reasoning about the bug.
-
Read the right error message
-
Check the plug: check that all the connections are correct.
-
Separate facts from interpretetion: revisit the processor specification; recheck some of your assumed knowledge.
-
Divide and conquer: reduce the test case, test one assumption after the other.
-
Match the tool to the bug: learn special tools.
-
One change at a time: this is particularly deadly.
-
Keep an audit trail: use a version control system with local branching.
-
Get a fresh view: explain the code to your car - seriously!
-
If you didn’t fix it, it ain’t fixed: changing code that works can only introduce new bugs.
-
Cover your bugfix with a regression test: the easiest way to build up a test suite.